Using a Chart
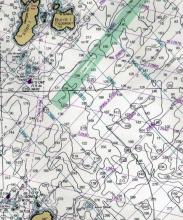
A nautical chartChart
A nautical map giving navigation information, including: water depth; shoals, rocks, and other dangers; and aids to navigation such as lighthouses, buoys, and beacons. Charts use special symbols and abbreviations to convey information for mariners. has a description that starts with its name and perhaps a catalog number. It includes the type of projection, the scaleScale
Scale on charts and maps is the ratio of the map to the real world it depicts. On a 1:40,000 chart, a measurement unit like an inch is 40,000 of those units on the surface of the earth.
Read More of the chart, such as 1:40,000, and the chart datumDatum
Reference point from which other measurements are made. Charts will state the datum for their depth and height measurements as well as for their position information., typically at a very low tide (mean lower low water Mean lower low water
A datum or basis from which depths are measured on many charts. It is the average of the lowest of the two low tides each day on a 19 year cycle. Since it is a mean low tides can be lower than this.). Elevations are often given from a mean high water. Most charts show true northTrue North
The direction of the North Pole from any place on the earth's surface, through which all meridians of longitude pass on maps and charts.
Read More on the top, with a compass roseCompass rose
Outer and two inner circles engraved on a nautical chart, used for laying off courses or bearings.
Read More that tells the location of true north, magnetic northMagnetic North and Variation
Magnetic north is one of two points on the globe where the line of total magnetic force is vertical and towards which the magnetic needle points in all adjoining regions. Variation (also called magnetic declination) is the difference in direction between true north as determined by the earth's axis of rotation and magnetic north as determined by the earth's magnetism.
Read More, the variation between the two, and the change of variation each year, as the magnetic north pole moves.
Symbols on charts have meanings, listed in NOAA’s Chart Number 1. These include aids to navigationAids to navigation
Aids to navigation are artificial aids that have been created or built to aid the navigator. Buoys and lighthouses are examples. like buoysBuoy
A floating object designed for a special purpose often anchored to the sea bottom. Buoys range in size from large navigational buoys to lobster trap buoys. (lit, unlit, bells, gongs, etc.), lighthouses, and day beacons as well as natural features such as rocks and reefs; and man-made structures such as wrecks, water tanks, chimneys, and smokestacks. The bottom is shown topographically, with lines often at 18 feet deep, 30 feet, 60 feet, and 120 feet. These numbers are used because they are equivalent to 3, 5, 10, and 20 fathoms. Some charts published today replace feet and fathoms with meters.
Though most charts do provide a scale of nautical milesNautical Mile
One minute (or 1/60th of a degree) of latitude. Because the earth is not a perfect sphere, the length of a nautical mile varies somewhat according to latitude.
Read More and yards, navigators often use the latitudeLatitude
Latitude is the measure of how far north or south one is from the equator. This angular measurement is given in degrees, minutes (1/60th of a degree), and seconds (1/60th of a minute) of arc. The nautical mile is set as the distance on the surface of the earth of 1 minute of arc, being an average of 6,080 feet.
Read more markings on the chart’s side instead, as one minute of latitude equals one nautical mile. Some small scale charts show a grid in colored lines used with long range radio navigation equipment, like loranLORAN
A system of long-range navigation invented during World War II, in which pulsed signals sent out by 2 pairs of radio stations are used to determine the geographical position of a ship or airplane. It is maintained today as a backup to GPS. or Omega.

